The family of regression models includes two especially popular members: linear regression and logistic regression (with probit regression more popular than logistic in some research areas). Common knowledge, as taught in statistics courses, is: use linear regression for a continuous outcome and logistic regression for a binary or categorical outcome. But why not use linear regression for a binary outcome? the two common answers are: (1) the linear regression can produce predictions that are not binary, and hence "nonsense" and (2) inference based on the linear regression coefficients will be incorrect.
 I admit that I bought into these "truths" for a long time, until I learned never to take any "statistical truth" at face value. First, let us realize that problem #1 relates to prediction and #2 to description and causal explanation. In other words, if issue #1 can be "fixed" somehow, then I might consider linear regression for prediction even if the inference is wrong (who cares about inference if I am only interested in predicting individual observations?). Similarly, if there is a fix for issue #2, then I might consider linear regression as a kosher inference mechanism even if it produces "nonsense" predictions.
The 2009 paper Linear versus logistic regression when the dependent variable is a dichotomy by Prof. Ottar Hellevik from Oslo University de-mystifies some of these issues. First, he gives some tricks that help avoid predictions outside the [0,1] range. The author identifies a few factors that contribute to "nonsense predictions" by linear regression:
- interactions that are not accounted for in the regression
- non-linear relationships between a predictor and the outcome
The suggested remedy for these issues is including interaction terms for categorical variables, and if numerical predictors are involved, then bucket them into bins and include those as dummies + interactions. So, if the goal is predicting a binary outcome, linear regression can be modified and used.
Now to the inference issue. "The problem with a binary dependent variable is that the homoscedasticity assumption (similar variation on the dependent variable for units with different values on the independent variable) is not satisfied... This seems to be the main basis for the widely held opinion that linear regression is inappropriate with a binary dependent variable". Statistical theory tells us that violating the homoscedasticity assumption results in biased standard errors for the coefficients, and that the coefficients might not be the most precise in terms of variance. Yet, the coefficients themselves remain unbiased (meaning that with a sufficiently large sample they are "on target"). Hence, with a sufficiently large sample we need not worry! Precision is not an issue in very large samples, and hence the on-target coefficients are just what we need.
I will add that another concern is that the normality assumption is violated: the residuals from a regression model on a binary outcome will not look very bell-shaped... Again, with a sufficiently large sample, the distribution does not make much difference, since the standard errors are so small anyway.
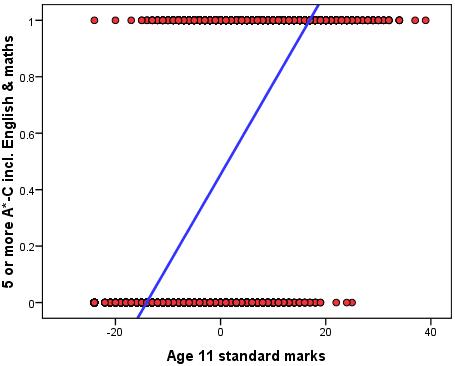
 |
| Chart from Hellevik (2009) |
Hellevik's paper pushes the envelope further in an attempt to explore "how small can you go" with your sample before getting into trouble. He uses simulated data and compares the results from logistic and linear regression for fairly small samples. He finds that the differences are minuscule.
The bottom line: linear regression is kosher for prediction if you take a few steps to accommodate non-linear relationships (but of course it is not guaranteed to produce better predictions than logistic regression!). For inference, for a sufficiently large sample where standard errors are tiny anyway, it is fine to trust the coefficients, which are in any case unbiased.

