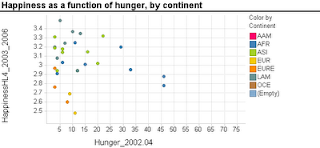
Scatterplots are extremely popular and useful graphical displays for examining the relationship between two numeric variables. They get even better when we add the use of color/hue and shape to include information on a third, categorical variable (or we can use size to include information on an additional numerical variable, to produce a "bubble chart"). For example, say we want to examine the relationship between the happiness of a nation and the percent of the population that live in poverty conditions -- using 2004 survey data from the World Database of Happiness. We can create a scatterplot with "Happiness" on the y-axis and "Hunger" on the x-axis. Each country will show up as a point on the scatterplot. Now, what if we want to compare across continents? We can use color! The plot below was generated using Spotfire. It took just a few seconds to generate it.
 Now let's try creating a similar graph in Excel.
Creating a scatterplot in Excel is very easy. It is even not too hard to add size (by changing chart type from X Y (scatter) to Bubble chart). But adding color or shape, although possible, is very inconvenient and error-prone. Here's what you have to do (in Excel 2007, but it is similar in 2003):
Besides being tedious, this procedure is quite prone to error, especially if you have many categories and/or many rows. It's a shame that Excel doesn't have a simpler way to generate color-coded scatterplots - almost every other software does.
 Now let's try creating a similar graph in Excel.
Creating a scatterplot in Excel is very easy. It is even not too hard to add size (by changing chart type from X Y (scatter) to Bubble chart). But adding color or shape, although possible, is very inconvenient and error-prone. Here's what you have to do (in Excel 2007, but it is similar in 2003):
- Sort your data by the categorical variable (so that all rows with the same category are adjacent, e.g., first all the Africa rows, then America rows, Asia rows, etc.).
- Choose only the rows that correspond to the first category (say, Africa). Create a scatterplot from these rows.
- Right-click on the chart and choose "Select Data Source". Or equivalently, choose in the Chart Tools Design> Data> Select data. Click "Add" to add another series. Enter the area on the spreadsheet that corresponds to the next category (America), separately choosing the x column and y column areas. Then keep adding the rest of the categories (continents) as additional series.
Besides being tedious, this procedure is quite prone to error, especially if you have many categories and/or many rows. It's a shame that Excel doesn't have a simpler way to generate color-coded scatterplots - almost every other software does.